Lighthouse Score Explained: Metric Weighting and Audit Triage
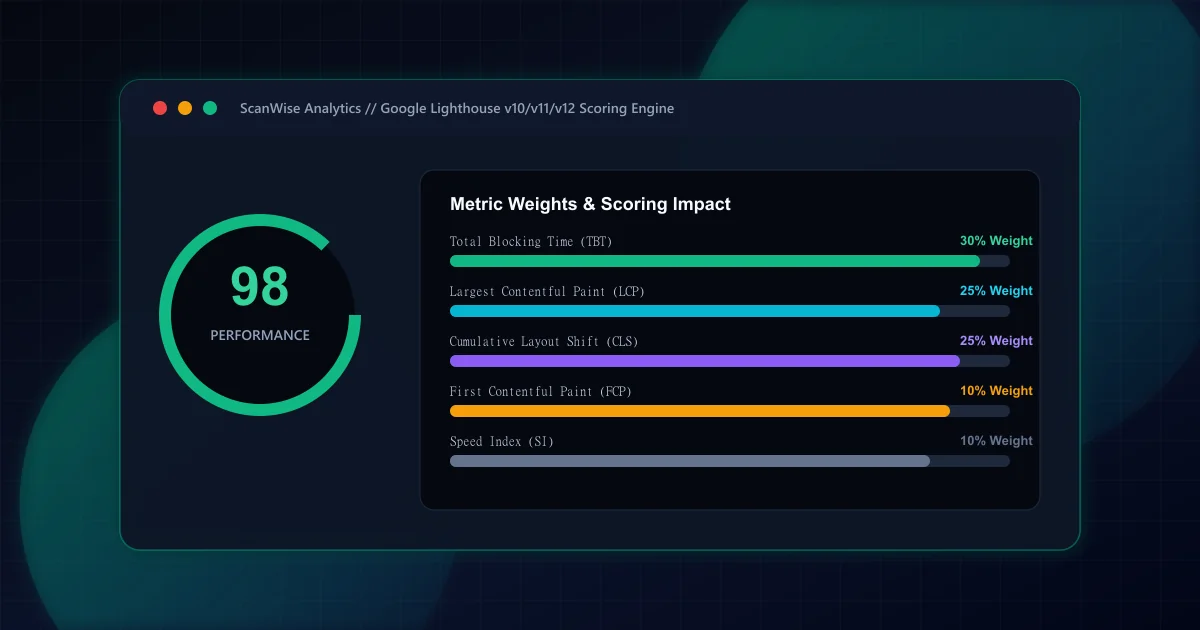
Many engineering teams treat the Google Lighthouse performance score as a black box, assuming that clearing five yellow diagnostic warnings will automatically lift their score by five points. In reality, the overall score (0 to 100) is determined strictly by five weighted metrics evaluated against log-normal distribution curves. According to official Google Chrome Lighthouse Scoring Calculator documentation, diagnostic audits like 'minify CSS' or 'properly size images' do not directly contribute points—they are merely qualitative diagnostics highlighting why a specific metric is failing.
As established in our how to improve page speed pillar guide, understanding the exact mathematical weight of each metric ensures that engineering time is spent where it yields the highest measurable return:
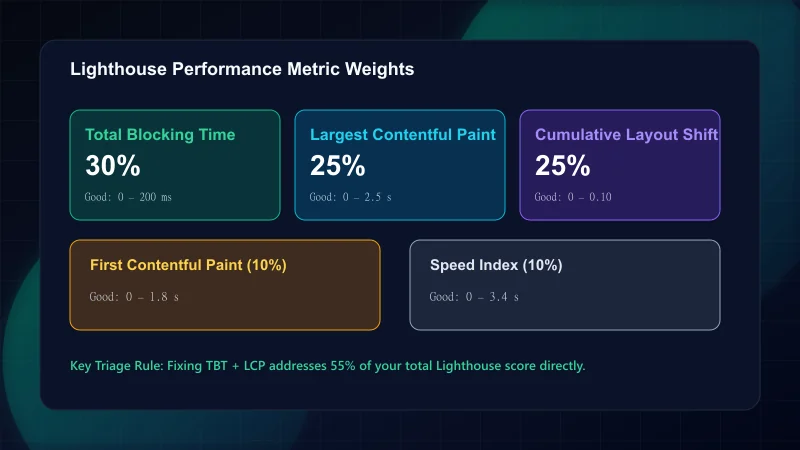
Lighthouse Performance Metric Weights
| Lighthouse Metric | Weight | Good Threshold (Score 90–100) | Needs Improvement (50–89) | Poor (0–49) |
|---|---|---|---|---|
| Total Blocking Time (TBT) | 30% | 0 ms – 200 ms | 200 ms – 600 ms | > 600 ms |
| Largest Contentful Paint (LCP) | 25% | 0 ms – 2,500 ms | 2,500 ms – 4,000 ms | > 4,000 ms |
| Cumulative Layout Shift (CLS) | 25% | 0 – 0.10 | 0.10 – 0.25 | > 0.25 |
| First Contentful Paint (FCP) | 10% | 0 ms – 1,800 ms | 1,800 ms – 3,000 ms | > 3,000 ms |
| Speed Index (SI) | 10% | 0 ms – 3,400 ms | 3,400 ms – 5,800 ms | > 5,800 ms |
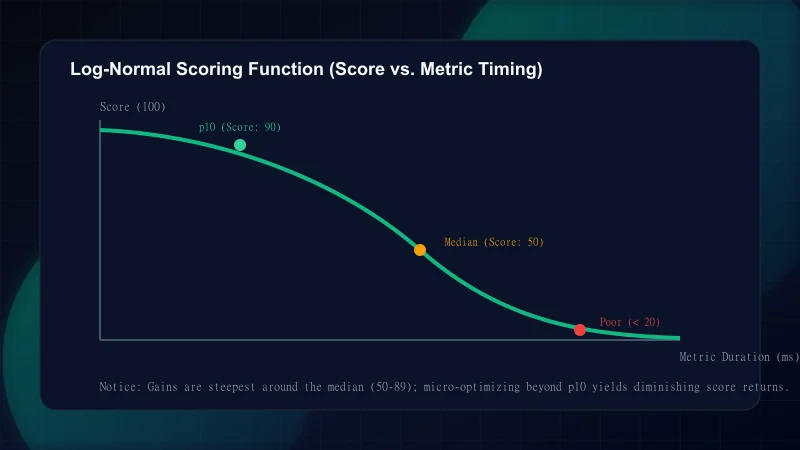
Lighthouse maps raw timing metrics (such as 320ms TBT) to a 0–1 score using log-normal distribution functions calibrated against HTTP Archive real-world web data. The curve establishes two critical calibration points: the 10th percentile (p10, representing top-tier performance awarded a score of 90) and the median (control point, representing average performance awarded a score of 50).
This non-linear curve means that shaving 200ms off an LCP that sits at 3,000ms generates a massive score increase because you are operating on the steep slope near the median. In contrast, shaving 200ms off an LCP that is already at 1,200ms yields almost no score difference because you are already near the top asymptote of the curve.
One of the most frequent frustrations among web architects is seeing a pristine 98 or 100 Lighthouse score in development, only to discover failing Core Web Vitals in Google Search Console. To resolve this discrepancy, teams must understand the foundational differences between lab environments and the Chrome User Experience Report (CrUX).
When faced with 30 distinct Lighthouse audit warnings, follow this ordered triage sequence to maximize score recovery with minimum developer effort:
Lighthouse Audit Triage Sequence
Step 1: Eliminate Render-Blocking CSS and Script Tags (FCP & LCP Lift)
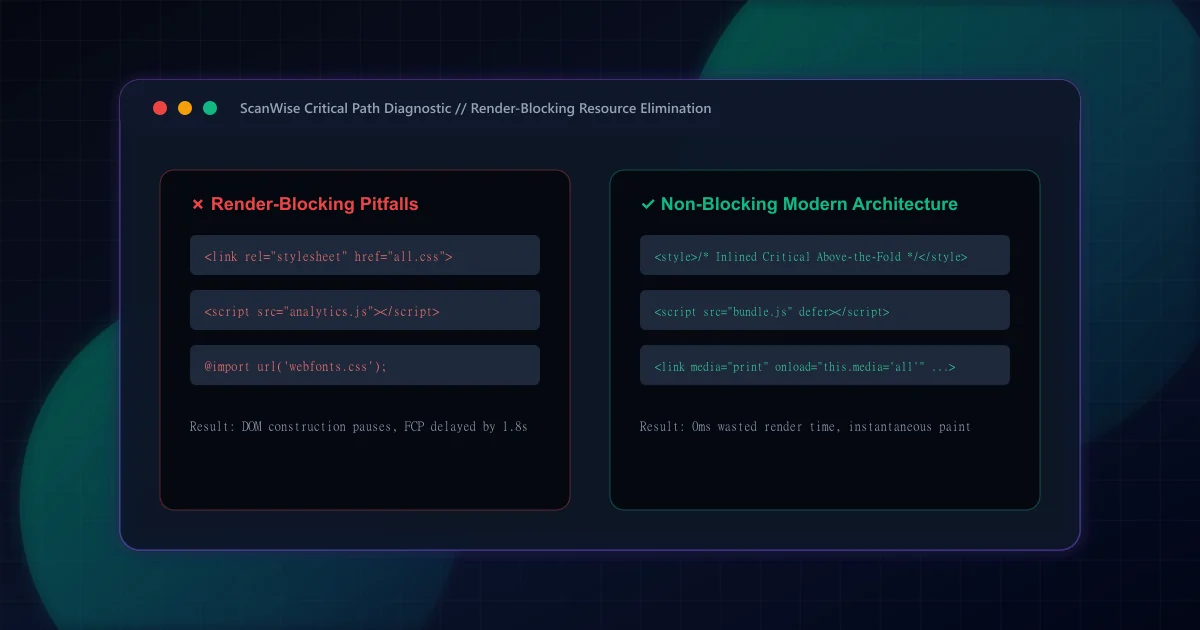
Follow our guide to eliminating render-blocking resources. Addingdeferto scripts and inlining critical CSS immediately unblocks the HTML parser, cutting FCP by up to 1,500ms and accelerating LCP asset discovery.Step 2: Reduce Total Blocking Time via Chunk Splitting (TBT Lift)
Because TBT carries a 30% weight, breaking up JavaScript tasks exceeding 50 milliseconds directly unlocks up to 30 score points. Remove heavy polyfills, transition to React Server Components, and lazily load non-critical client packages.Step 3: Preload and Size the LCP Hero Asset (LCP Lift)
Ensure the largest above-the-fold image uses Next.jspriorityattribute or<link rel="preload">in modern WebP or AVIF formats. As documented in our Next.js Core Web Vitals guide, preloading avoids discovery delays.Step 4: Explicitly Reserve Layout Dimensions (CLS Lift)
Add explicitwidthandheightattributes to all images, videos, and dynamic ad containers. Eliminating layout shifts secures the remaining 25% of the score with minimal refactoring complexity.
Avoid these five frequent engineering traps that waste time or artificially inflate lab scores without improving real-world user experience:
Common Lighthouse Optimization Mistakes
| Mistake | Why It Hurts | The Fix |
|---|---|---|
| Gaming Lighthouse by delaying scripts with setTimeout(5000) | Artificially passes lab TBT, but causes catastrophic real-world INP failures when users interact | Remove unnecessary JavaScript bundles entirely or offload heavy computation to Web Workers |
| Obsessing over low-weight Speed Index diagnostics | Engineers spend days micro-optimizing visual frame completion for a metric with only 10% weight | Focus on TBT (30%) and LCP (25%) which command the dominant share of total performance score |
| Testing on high-end developer MacBooks without CPU throttling | Produces false 99/100 scores that collapse when tested on simulated mid-tier mobile hardware | Always test with DevTools 4x CPU throttling enabled or use automated headless CI runners |
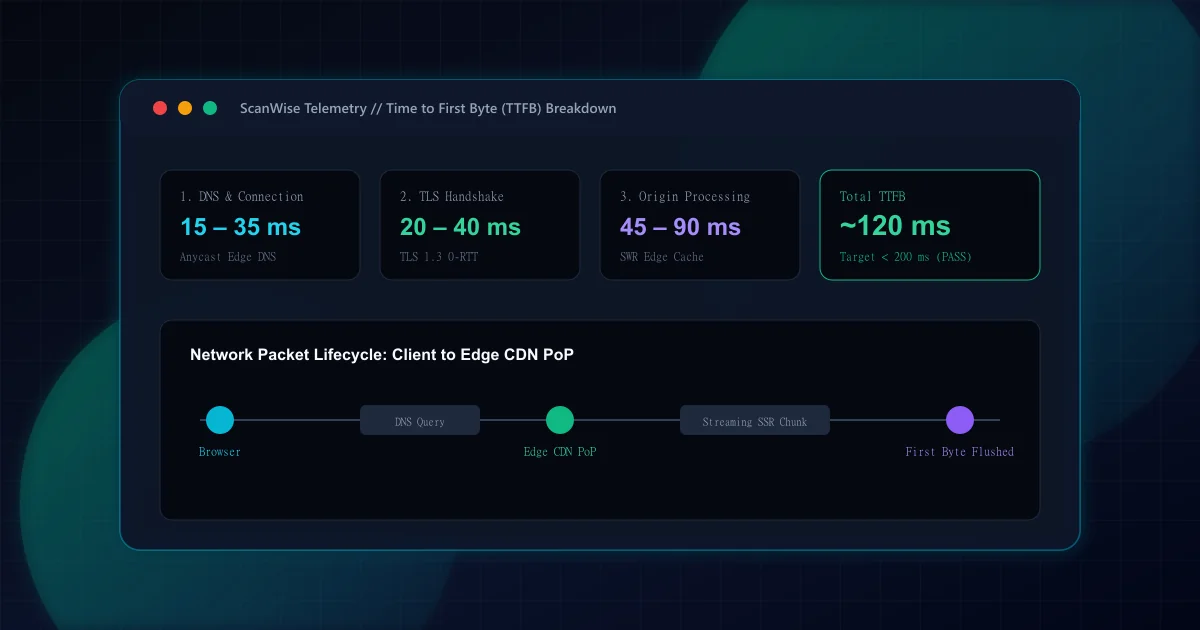
| Ignoring origin server response time (TTFB) | A slow 1.2s server response creates an unmovable floor on both FCP and LCP scores | Implement edge CDN caching and streaming SSR as detailed in our TTFB optimization guide |
| Running single test passes instead of calculating medians | Noise from background OS processes causes score swings of 10–15 points between runs | Run at least 3 to 5 iterations and record the median performance score across runs |
The only way to maintain high Lighthouse scores across large engineering organizations is to enforce automated performance budgets in CI/CD pull requests before code reaches staging or production.
Frequently Asked Questions
How are individual metric weights distributed in the Lighthouse performance score?
In Lighthouse v10, v11, and v12, the performance score is distributed across five metrics: Total Blocking Time (TBT) at 30%, Largest Contentful Paint (LCP) at 25%, Cumulative Layout Shift (CLS) at 25%, First Contentful Paint (FCP) at 10%, and Speed Index (SI) at 10%.
Why does my site get 95 in Lighthouse but fail Core Web Vitals in Search Console?
Lighthouse measures synthetic lab performance on a simulated cold-cache mobile device loading a single page. Google Search Console evaluates field data from the Chrome User Experience Report (CrUX) collected from millions of real users over 28 days, including metrics like Interaction to Next Paint (INP) across real multi-page interactive sessions.
Does simulated throttling in Lighthouse skew CPU-bound JavaScript execution?
Yes. Standard Lighthouse runs use simulated throttling, multiplying CPU task execution time by 4x to model budget mobile processors. Heavy JavaScript parsing and hydration that barely register on modern laptops will cause massive TBT spikes under simulated throttling.
Which metric should engineering teams fix first to move score most efficiently?
Total Blocking Time (TBT) is the highest-leverage metric to fix first because it carries the highest individual weighting (30%) and directly correlates with main-thread JavaScript execution. Resolving long tasks also accelerates LCP and improves field INP.
Why do consecutive Lighthouse runs on the same page produce fluctuating scores?
Score fluctuations typically stem from network variability, dynamic third-party ad tags, server response jitter, and client-side CPU scheduling. Running multiple passes (such as 3 or 5 runs) and taking the median score provides a stable, reproducible baseline.

Engineering & Technical Audit Team
The ScanWise engineering and technical SEO team researches web performance, Core Web Vitals, crawl mechanics, and digital compliance.
Related Engineering Guides
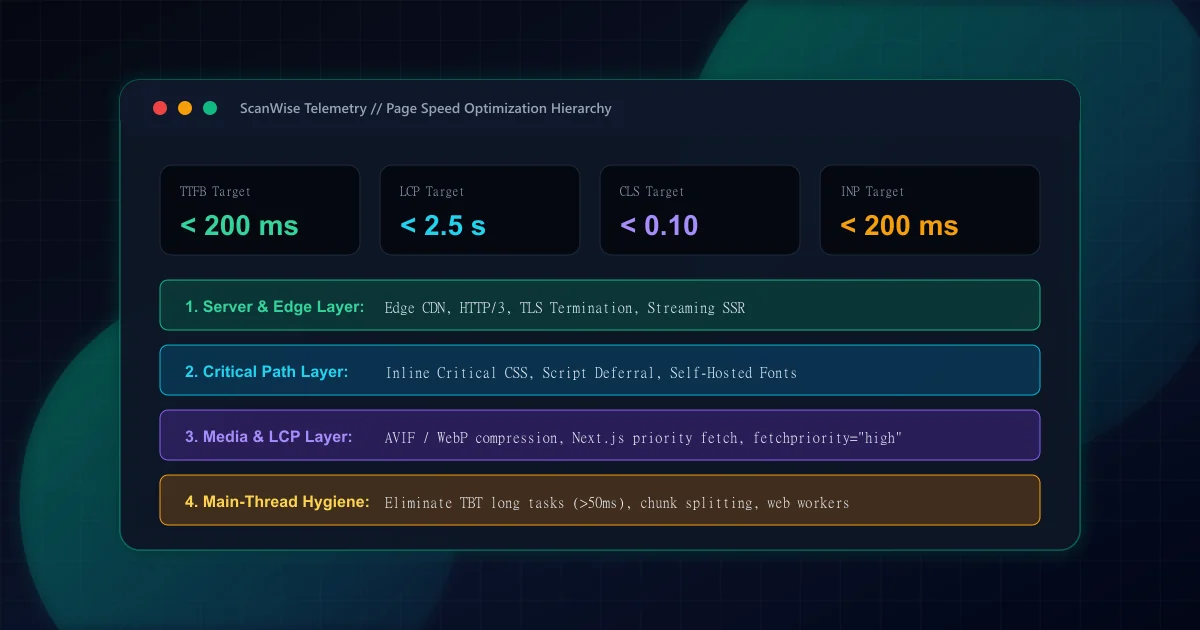
How to Improve Page Speed: Ordered Fixes by Engineering Impact
Systematic guide to improving page speed by measured impact. Prioritize server response, critical CSS, resource hinting, and image payloads with real benchmarks.
What Is TTFB and How to Reduce Time to First Byte
Learn what Time to First Byte (TTFB) measures and discover actionable engineering fixes: edge CDN routing, server-side caching, and streaming SSR architecture.
Render-Blocking Resources: How to Find and Eliminate Them
Eliminate render-blocking CSS and JavaScript. Learn how to identify critical path blockers in DevTools, inline essential styles, and defer script execution safely.