How to Improve Page Speed: Ordered Fixes by Engineering Impact

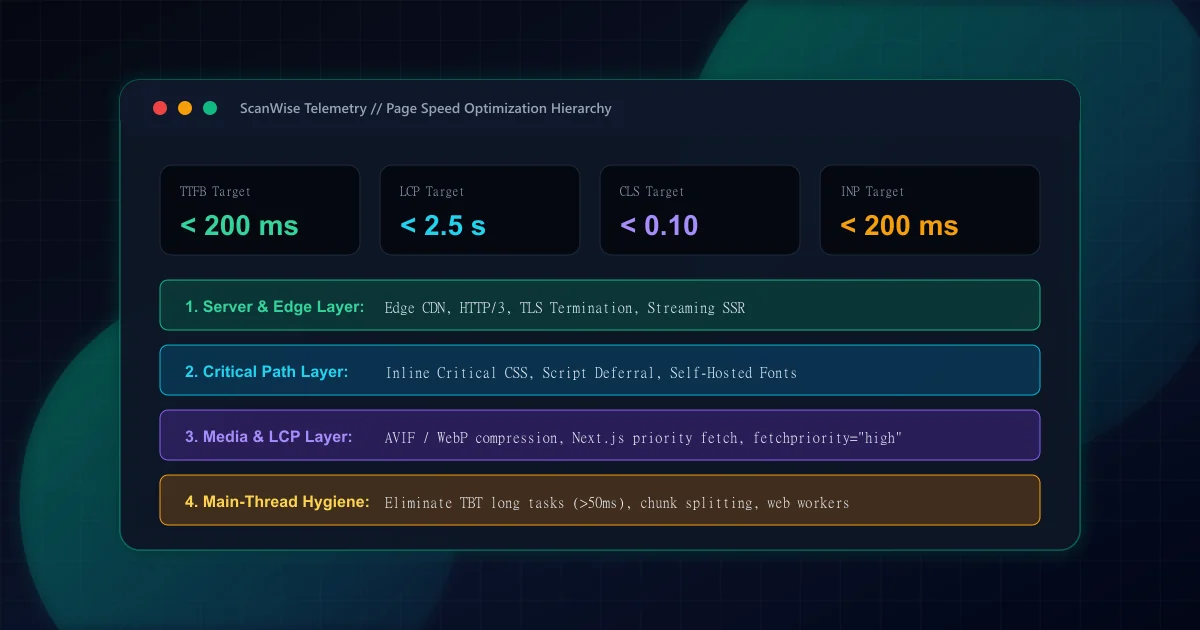
Many development teams begin performance optimization by compressing images or refactoring small React components. While image compression is essential, an unoptimized server that takes 800 milliseconds to deliver the initial HTML document imposes a hard performance floor that no amount of client-side tuning can overcome. According to Google Search Central documentation on Core Web Vitals, user experience metrics are evaluated at the 75th percentile of real-world visits, where mobile latency and packet loss amplify every server-side delay.
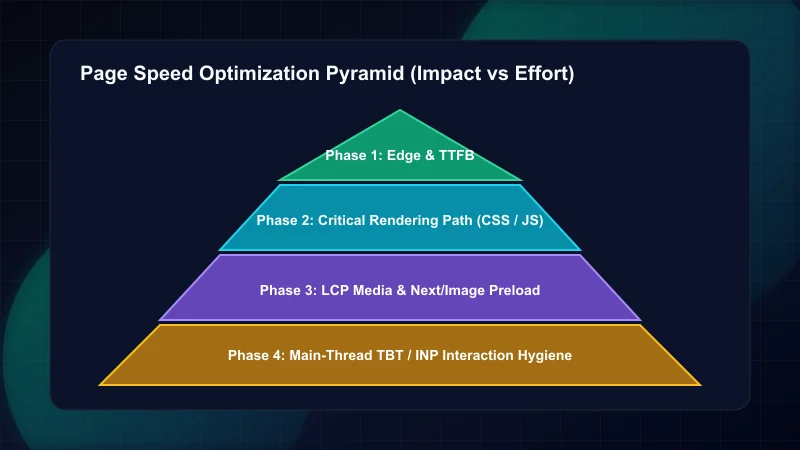
To maximize engineering efficiency, performance improvements should follow a strict four-phase hierarchy: (1) Origin response and edge delivery, (2) Critical rendering path unblocking, (3) LCP asset delivery, and (4) Main-thread interaction hygiene. Each phase unlocks the full potential of the next.
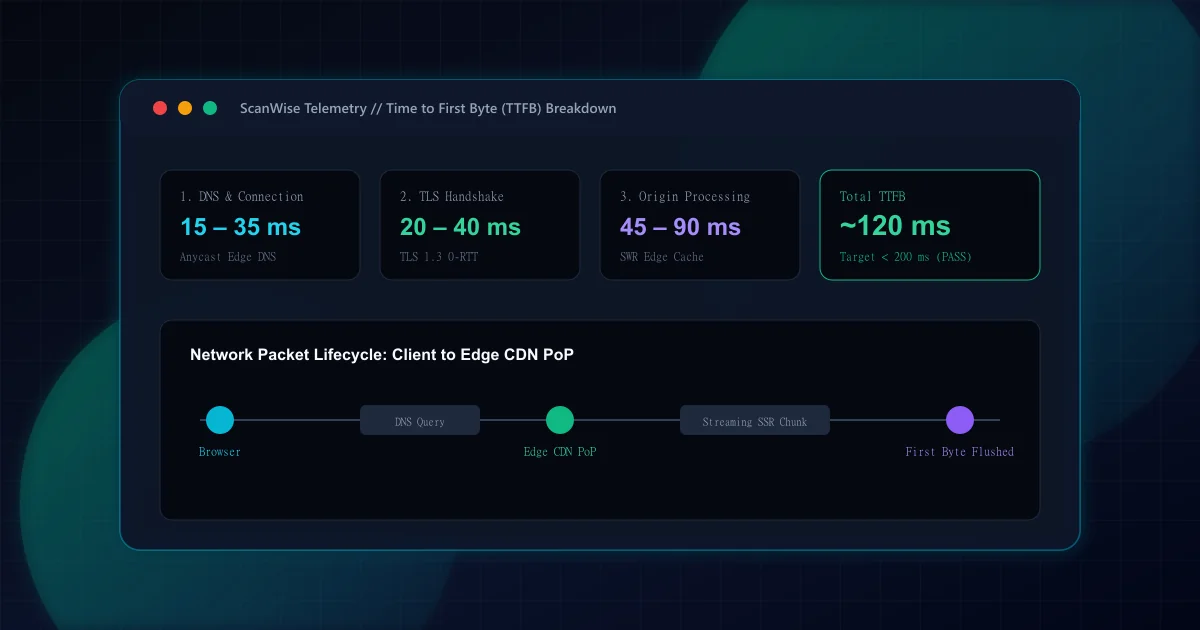
Time to First Byte measures the duration between the browser initiating the HTTP request and receiving the first byte of response data. In modern web architectures, a sluggish TTFB is commonly caused by distant geographic origins, cold database queries, unmemoized server-side rendering (SSR), and unnecessary redirect hops. To dive deeper into server tuning, read our comprehensive guide on how to reduce TTFB and review the fundamental definition in our TTFB glossary entry.
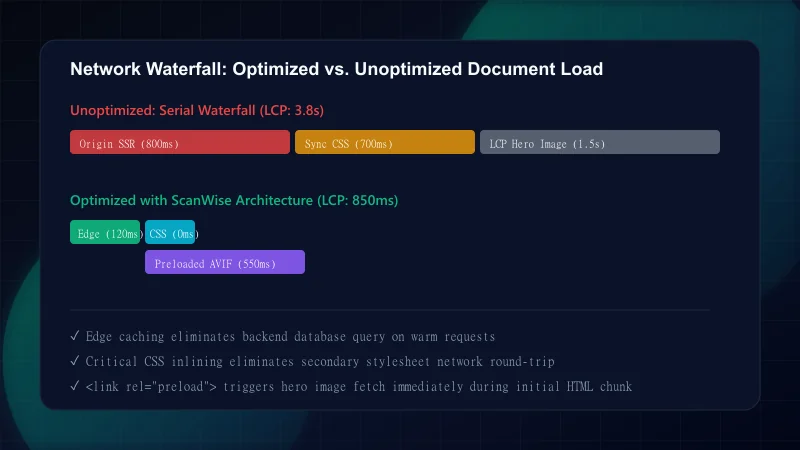
Deploying your application on an edge-distributed Content Delivery Network (CDN) allows the browser to negotiate TLS handshakes at a nearby point of presence (PoP). For dynamic pages that cannot be purely statically generated, streaming server-side rendering enables the origin to flush the document <head> and critical layout skeleton immediately while background database promises resolve.
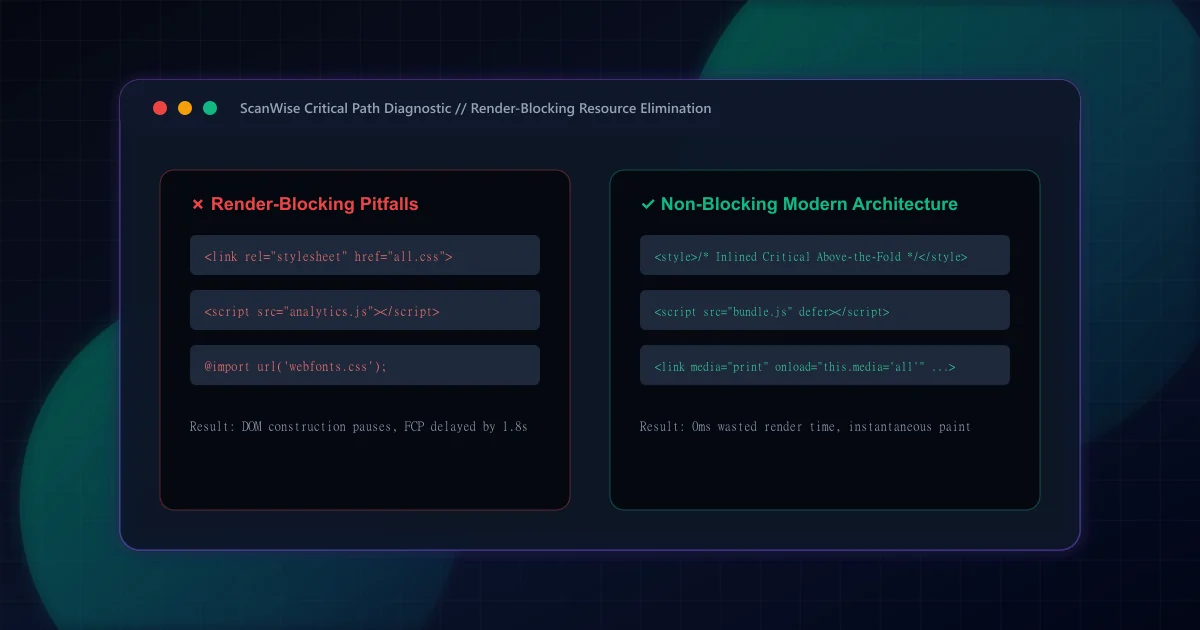
Once HTML arrives at the client, the browser parser begins constructing the Document Object Model (DOM). However, whenever the parser encounters an external synchronous stylesheet (<link rel="stylesheet">) or an unadorned script (<script src="...">), parsing halts completely until that resource is downloaded, parsed, and executed. To diagnose these blockers, consult our technical deep-dive on render-blocking resources.
To achieve a sub-second First Contentful Paint (FCP), modern front-end frameworks must inline critical above-the-fold CSS directly into the initial HTML payload and load non-critical stylesheets asynchronously. Similarly, all client application bundles must use defer or async loading attributes to keep the main thread clear during initial DOM construction.
Page Speed Fixes Ordered by Measured Impact
| Optimization Step | Target Metric | Typical Gain | Implementation Complexity |
|---|---|---|---|
| Edge CDN Caching & TTFB Reduction | TTFB / FCP / LCP | 300ms – 1,200ms | Medium (DNS / Edge Config) |
| Eliminate Render-Blocking CSS/JS | FCP / Speed Index | 200ms – 600ms | Medium (Build Pipeline) |
| Priority Hero Image Preloading | LCP | 400ms – 1,500ms | Low (Markup Attribute) |
| Self-Hosted Subset Font Inlining | FCP / CLS | 150ms – 400ms | Low (next/font Configuration) |
| Long Task Yielding (useTransition) | INP / TBT | 100ms – 500ms | High (Component Refactoring) |
| Aspect-Ratio Container Sizing | CLS | 0.15+ Shift Score | Low (CSS aspect-ratio) |
Largest Contentful Paint marks the moment when the main content element—typically a hero photograph, banner graphic, or major heading block—is rendered visible in the viewport. According to web.dev LCP optimization guidance, LCP must occur within 2.5 seconds at the 75th percentile to earn a 'Good' rating. In Next.js applications, achieving this requires pairing modern image codecs with explicit fetch prioritization.
Converting legacy JPEG and PNG images to AVIF and WebP formats frequently reduces image file sizes by 40% to 70% with negligible visual degradation. For detailed configuration patterns, examine our guide to Next.js image optimization with AVIF and WebP. Furthermore, declaring fetchpriority="high" on your viewport hero graphic tells the browser's preload scanner to allocate network priority ahead of below-the-fold assets.
In March 2024, Google officially transitioned Interaction to Next Paint (INP) to a Core Web Vital, replacing First Input Delay (FID). While FID measured only the input delay of the very first click, INP assesses the latency of all discrete clicks, taps, and keystrokes throughout the entire session lifecycle. For comprehensive code patterns, see our guide on React INP optimization.
When an interaction triggers complex client-side calculations or massive DOM updates, the browser's main thread becomes blocked. Any JavaScript task exceeding 50 milliseconds constitutes a 'Long Task' under W3C Long Tasks API specifications. By chunking intensive operations using startTransition or yielding execution via scheduler.yield(), developers allow the browser to paint intermediate UI frames without perceptible input lag.
Five-Step Remediation Procedure
Step 1: Establish a Multi-Run Synthetic Baseline
Execute at least 3 to 5 independent Lighthouse audits using mobile CPU throttling (4x slowdown) to establish a statistically reliable median score before changing any code.Step 2: Audit and Fix Upstream Server Latency
Inspect network timing in Chrome DevTools. If TTFB exceeds 200ms on static routes or 400ms on dynamic routes, implement edge CDN caching, memoize database lookups, or enable streaming SSR.Step 3: Eliminate Render-Blocking CSS and Script Tags
Inspect the DevTools Coverage tab. Extract critical CSS required for initial viewport render, load remaining rules asynchronously, and ensure all non-critical scripts declaredefer.Step 4: Optimize and Preload the LCP Element
Identify the exact DOM node assigned as LCP. If it is an image, convert it to AVIF/WebP, preload it in the document<head>, and remove lazy-loading attributes.Step 5: Audit JavaScript Execution and Defer Third Parties
Profile CPU usage in the DevTools Performance panel. Split monolithic JavaScript chunks, break up long tasks exceeding 50ms using micro-yielding, and load tag managers via Web Workers.
Top 4 Page Speed Anti-Patterns
| Mistake | Why It Hurts | The Fix |
|---|---|---|
Lazy loading the above-the-fold hero image (loading="lazy"). | Browsers delay fetching lazy-loaded images until layout is fully computed, delaying LCP by 500ms to 2,000ms. | Set loading="eager" and fetchpriority="high" on the primary hero image in the initial HTML. |
Relying on external Google Fonts CDN links (fonts.googleapis.com). | Requires separate DNS, TCP, and TLS roundtrips, causing flash of invisible text (FOIT) and layout shifts. | Self-host subsetted WOFF2 font files locally using modern tools like next/font. |
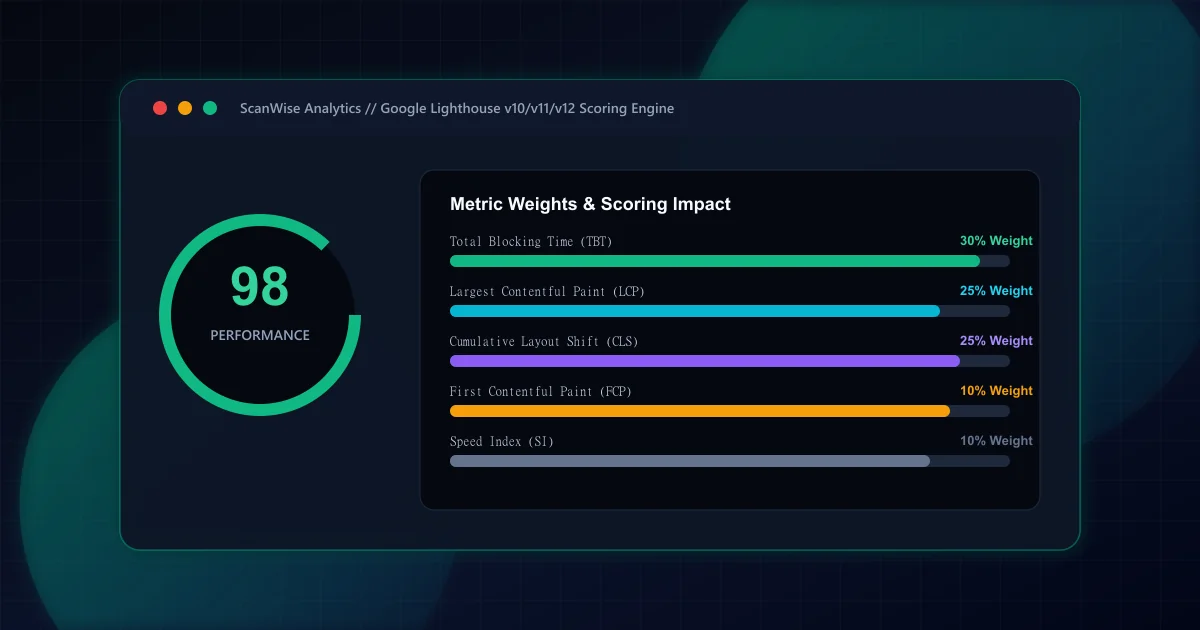
| Treating Lighthouse 100/100 as proof of real-world user speed. | Lighthouse measures synthetic single-run lab performance on a clean device without real network variance or user gestures. | Monitor 75th percentile field telemetry in Chrome User Experience Report (CrUX) and Search Console. |
| Bundling large third-party tracking scripts into the critical path. | Client-side tag managers execute heavy JavaScript that blocks the main thread, damaging TBT and INP scores. | Defer marketing tags until after initial user interaction or execute them off-thread via Partytown. |
Relying on a single test run or an unthrottled desktop connection produces misleading optimism. Professional engineering teams validate speed improvements across both synthetic lab environments and field user data:
- Google PageSpeed Insights: Combines synthetic lab diagnostics powered by Lighthouse with real-world 28-day field data from the Chrome User Experience Report (CrUX).
- Chrome DevTools Performance Panel: Provides microsecond-level CPU flame charts, Long Task identification, and event timing traces.
- Google Search Console Core Web Vitals Report: Surfaces site-wide URL groups failing LCP, INP, or CLS thresholds across authentic mobile and desktop visitors.
- ScanWise Multi-Pillar Scanner: Automatically audits Core Web Vitals, crawl mechanics, accessibility, and security headers in unified CI/CD pipelines.
- Google Search Central: Understanding Core Web Vitals — Official search ranking guidelines for page experience.
- web.dev: Optimize Largest Contentful Paint — Deconstructs LCP into four sub-parts and actionable solutions.
- web.dev: Interaction to Next Paint (INP) — Architectural guide to measuring and improving main-thread responsiveness.
- W3C Long Tasks API 1.0 — Standard specification defining 50ms task boundaries on the browser UI thread.
Frequently Asked Questions
What is the single biggest factor affecting page speed?
Server response time (TTFB) is the single biggest architectural factor because it establishes a hard floor for all subsequent resource downloads. If your origin server takes 800ms to return the initial HTML, your Largest Contentful Paint cannot occur faster than 800ms regardless of client-side optimizations.
In what exact order should page speed optimizations be applied?
Optimize in four sequential phases: First, resolve server response latency and edge CDN caching (TTFB). Second, eliminate render-blocking CSS and JavaScript. Third, optimize and preload the primary hero image (LCP). Fourth, minimize main-thread JavaScript execution and break up long tasks (INP and TBT).
Does improving page speed directly increase search engine rankings?
Yes. Google uses Core Web Vitals as an official page experience ranking signal. While relevant content remains primary, when competing pages have similar topical relevance, superior page speed and stability provide a measurable competitive ranking advantage.
What is the difference between lab performance scores and field user metrics?
Lab data (such as Lighthouse) uses simulated network throttling and a predefined device profile to test reproducible synthetic page loads in isolation. Field data (such as CrUX) captures telemetry from real human visitors across thousands of varying device tiers, connection speeds, and interaction states.
How frequently should production performance budgets be audited in CI/CD?
Performance budgets should be verified automatically on every pull request using headless browser suites like Lighthouse CI or axe-core. This prevents bundle size regressions, unoptimized images, or blocking scripts from being merged into production branches.
Engineering & Technical Audit Team
The ScanWise engineering and technical SEO team researches web performance, Core Web Vitals, crawl mechanics, and digital compliance.
Related Engineering Guides
What Is TTFB and How to Reduce Time to First Byte
Learn what Time to First Byte (TTFB) measures and discover actionable engineering fixes: edge CDN routing, server-side caching, and streaming SSR architecture.
Render-Blocking Resources: How to Find and Eliminate Them
Eliminate render-blocking CSS and JavaScript. Learn how to identify critical path blockers in DevTools, inline essential styles, and defer script execution safely.
Lighthouse Score Explained: Metric Weighting and Audit Triage
Deconstruct how the Google Lighthouse performance score is calculated. Understand metric weightings, why 100/100 differs from field data, and what to fix first.