What Is TTFB and How to Reduce Time to First Byte

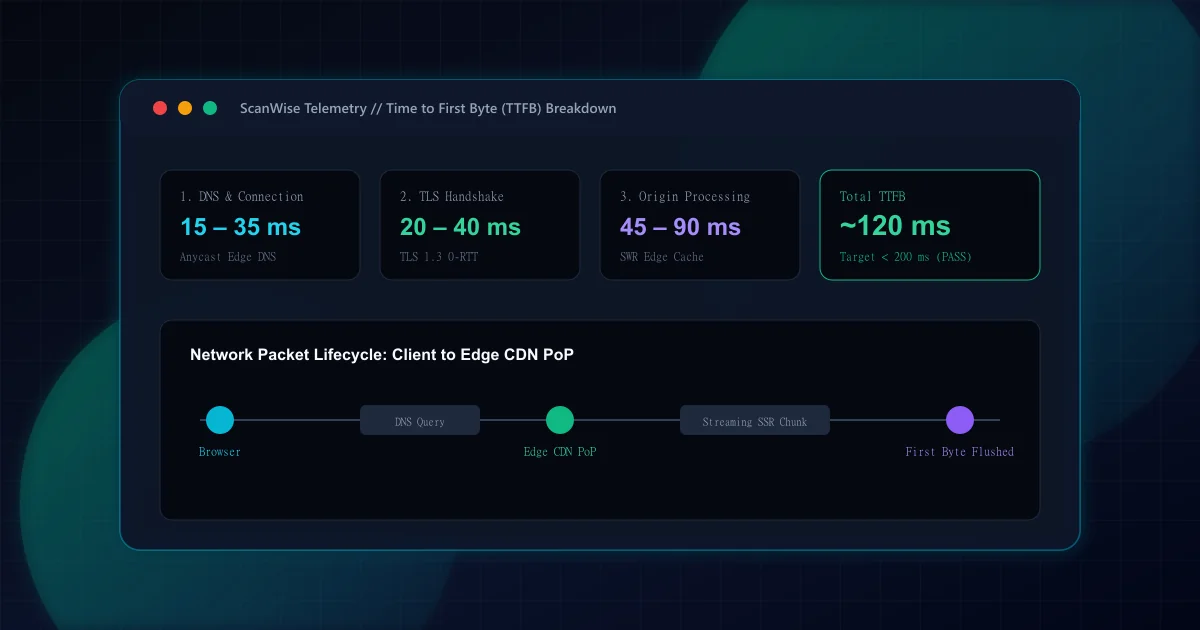
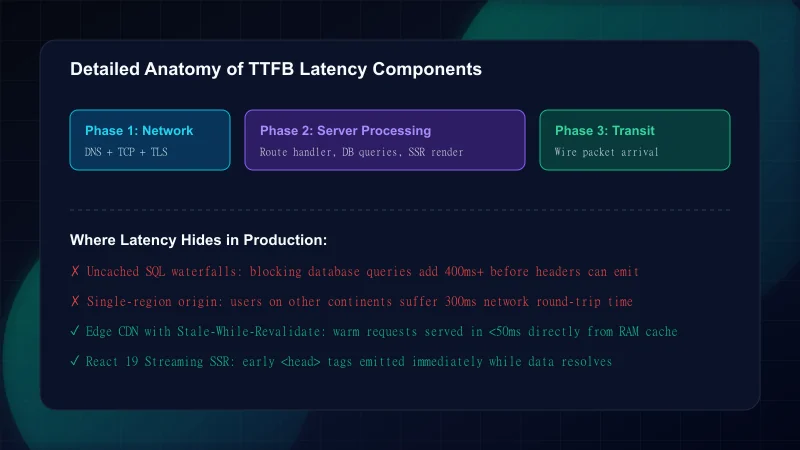
Time to First Byte is a fundamental web performance diagnostic metric that quantifies the responsiveness of your origin infrastructure and network transit. According to web.dev guidance on optimizing TTFB, TTFB encompasses three distinct sequential phases: (1) Network request propagation and DNS resolution, (2) Server-side processing and backend database execution, and (3) Initial HTTP response header transmission over the wire.
For a concise definition of metric boundaries, see our TTFB glossary entry. In our broader how to improve page speed pillar guide, we identify TTFB as the absolute performance ceiling: if your server takes 700 milliseconds to transmit the first byte, your page cannot paint content faster than 700 milliseconds under any conditions.
According to Chrome Web Vitals standards, TTFB ratings are categorized into three distinct performance tiers evaluated at the 75th percentile of real-world page visits:
Google Web Vitals TTFB Thresholds
| Rating Tier | Measured Threshold | Impact on User Experience |
|---|---|---|
| Good | <= 800 ms (Target: < 200 ms) | Immediate server response; browser begins rendering without noticeable delay. |
| Needs Improvement | 800 ms – 1,800 ms | Noticeable white-screen delay; risks pushing LCP past the 2.5-second threshold. |
| Poor | > 1,800 ms | Severe server stall; triggers user abandonment and high mobile bounce rates. |
While Google specifies 800 milliseconds as the boundary for 'Good', modern websites operating on edge networks routinely achieve TTFB values between 50 and 150 milliseconds. Because Largest Contentful Paint (LCP) includes TTFB as its first sub-part, every 100 milliseconds shaved from server response time translates directly into a 100-millisecond reduction in LCP.
Reducing TTFB requires addressing both network transport latency and origin compute overhead. The following four strategies eliminate the most severe server-side bottlenecks:
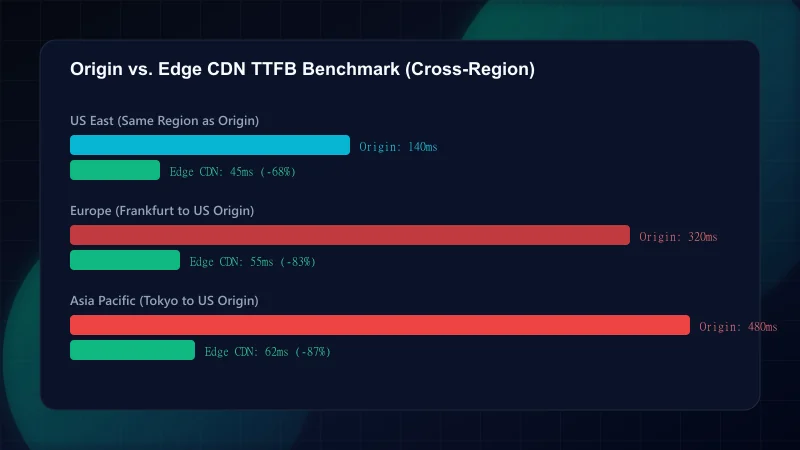
When an overseas visitor accesses a central server in North America, each TCP and TLS packet must cross physical oceans, adding 150–300 milliseconds of round-trip transit time (RTT). By routing traffic through an Edge CDN (such as Cloudflare, Fastly, or Vercel Edge Network), the TLS cryptographic handshake is terminated at a local point of presence mere milliseconds from the user.
// Configuring stale-while-revalidate edge caching headers in Next.js
export async function GET() {
  return new Response(JSON.stringify({ status: "ok" }), {
    headers: {
      "Content-Type": "application/json",
      // Serve cached content immediately; revalidate in background
      "Cache-Control": "public, max-age=60, s-maxage=3600, stale-while-revalidate=86400",
      "CDN-Cache-Control": "public, s-maxage=3600",
    },
  });
}In traditional monolithic SSR, the server must wait for all database queries and external microservices to finish before returning a single byte of HTML. With streaming SSR and React Suspense, the server immediately flushes the document <head>, CSS links, and page skeleton within 30–50 milliseconds. The browser can preload fonts and hero images while secondary dynamic blocks stream in as their data resolves.
Unindexed database queries are a primary culprit behind inflated server latency. If rendering a single dashboard or category route triggers 25 separate database roundtrips (the classic N+1 problem), server response time will degrade exponentially under concurrent traffic. Always audit database query execution plans, create indexes on foreign keys, and memoize query responses using Redis or in-memory LRU caches.
HTTP/3 operates over QUIC, a modern UDP-based transport protocol standardized in IETF RFC 9114. Unlike TCP, which suffers from head-of-line blocking whenever a single packet drops on mobile networks, QUIC multiplexes streams independently and supports zero-round-trip resumption (0-RTT), accelerating reconnection times for returning visitors.
Four-Step TTFB Diagnosis Procedure
Step 1: Isolate Network Latency Using curl Command-Line Timing
Execute curl with custom timing formatting (curl -w "@curl-format.txt" -o /dev/null -s https://example.com) to measure precise DNS lookup, TCP connect, and starttransfer durations.Step 2: Inspect Server Timing Headers (Server-Timing API)
EmitServer-Timing: db;dur=45, cache;dur=2response headers from your backend. Inspect the Chrome DevTools Network Timing tab to see exactly how much time was spent in database versus template rendering.Step 3: Verify Edge CDN Cache Hit Ratios
Inspect response headers forcf-cache-status: HITorx-vercel-cache: HIT. If your dynamic pages consistently returnMISS, adjust yourCache-Controlmax-age and cookie bypass rules.Step 4: Benchmark Cold Starts in Serverless Environments
If running on AWS Lambda or serverless functions, measure the difference between cold and warm invocations. Keep function bundle sizes small to maintain cold starts under 150ms.
Top 3 TTFB Anti-Patterns
| Mistake | Why It Hurts | The Fix |
|---|---|---|
| Executing blocking third-party API calls during SSR. | If an external payment or authentication API takes 600ms to respond, your server cannot emit HTML, causing high TTFB. | Move non-critical third-party integrations to asynchronous background workers or client-side fetch calls. |
| Relying on client-side SPA fetching for all data. | While client-side fetching yields a fast initial empty HTML shell (low TTFB), it destroys LCP and FCP because content cannot render until secondary scripts load. | Use streaming SSR with Suspense: deliver fast first bytes while streaming actual content. |
| Chaining redirects across protocol, www, and trailing slash. | Each redirect hop requires a complete HTTP request/response cycle, adding 150ms to 400ms per hop to total TTFB. | Normalize all internal links to their final canonical format and resolve edge redirects in a single hop. |
Measuring TTFB requires isolating network transmission from server computation. The following tools provide accurate diagnostic data without synthetic distortion:
- Chrome DevTools Network Tab: The 'Waiting for server response' bar in the Waterfall tab reflects exact TTFB for each individual network request.
- MDN PerformanceResourceTiming API: Programmatically capture
responseStart - requestStartin real-user monitoring (RUM) scripts across real human sessions. - cURL Command Line: The most reliable method to test origin server performance without browser extension interference or client rendering overhead.
- ScanWise Performance Audits: Automatically benchmarks TTFB across multiple pages, highlighting server latency bottlenecks alongside Core Web Vitals.
- web.dev: Optimize Time to First Byte — Google's technical guide to server response times and Web Vitals.
- MDN Web Docs: PerformanceResourceTiming.responseStart — W3C timing specification.
- IETF RFC 9114: HTTP/3 Protocol Specification — Technical standard for QUIC transport and multiplexing.
- Google Search Central: Understanding Core Web Vitals — Search ranking documentation.
Frequently Asked Questions
What is a good TTFB threshold according to Google guidelines?
Google recommends a Time to First Byte under 800 milliseconds for 75% of page visits in real-user field data. However, high-performing websites deployed on modern edge CDNs target a TTFB under 200 milliseconds on cached pages and under 400 milliseconds on dynamic SSR pages.
Why does TTFB matter if Largest Contentful Paint (LCP) is the Core Web Vital?
TTFB is the foundational prerequisite for LCP. The browser cannot begin parsing HTML, downloading stylesheets, or discovering hero images until the first byte arrives. A slow TTFB directly delays LCP millisecond for millisecond.
Can a CDN reduce TTFB for dynamic, uncacheable database queries?
Yes, but primarily on the network phase. An edge CDN terminates the user's TLS handshake locally, saving 100-300ms of cross-continental network latency. However, for the compute phase itself, dynamic database queries must still be optimized at the origin or edge database layer.
How does HTTP/3 or QUIC protocol impact server response latency?
HTTP/3 operates over UDP and eliminates TCP head-of-line blocking. It supports 0-RTT connection resumption, allowing returning users to send HTTP requests simultaneously with their TLS handshake, noticeably reducing initial connection latency.
How do you measure TTFB in Chrome DevTools versus synthetic Lighthouse runs?
In Chrome DevTools, inspect the Network tab and hover over the 'Waiting for server response' segment in the Waterfall. In Lighthouse, TTFB is reported in the 'Server response times are low' audit, which simulates mobile CPU and network throttling.
Engineering & Technical Audit Team
The ScanWise engineering and technical SEO team researches web performance, Core Web Vitals, crawl mechanics, and digital compliance.
Related Engineering Guides
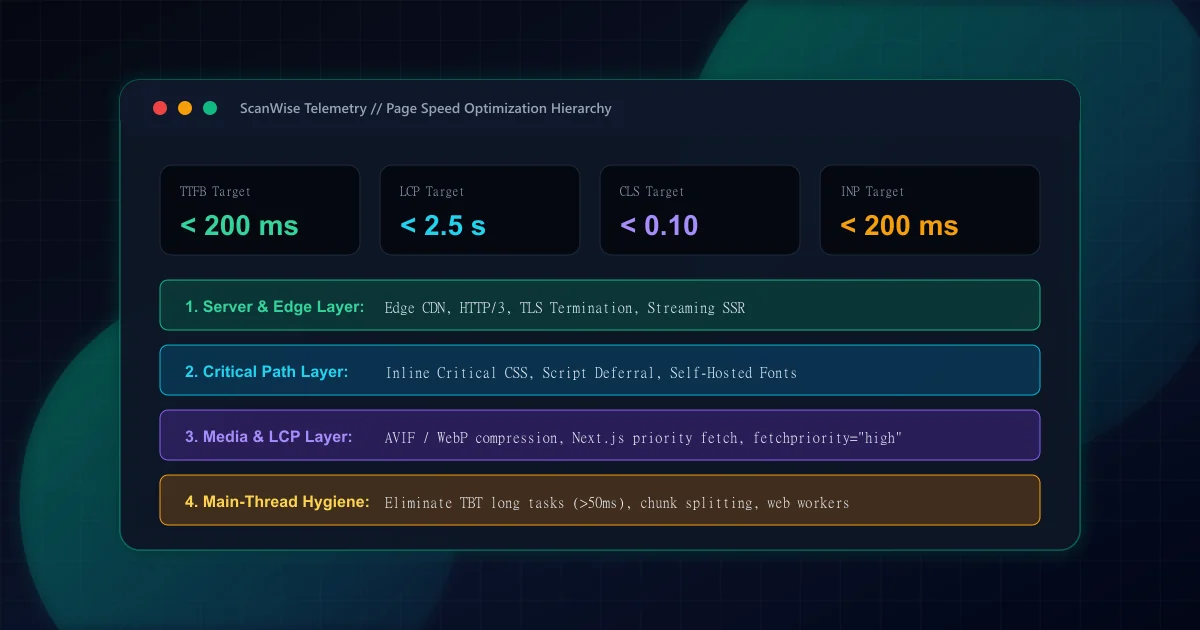
How to Improve Page Speed: Ordered Fixes by Engineering Impact
Systematic guide to improving page speed by measured impact. Prioritize server response, critical CSS, resource hinting, and image payloads with real benchmarks.
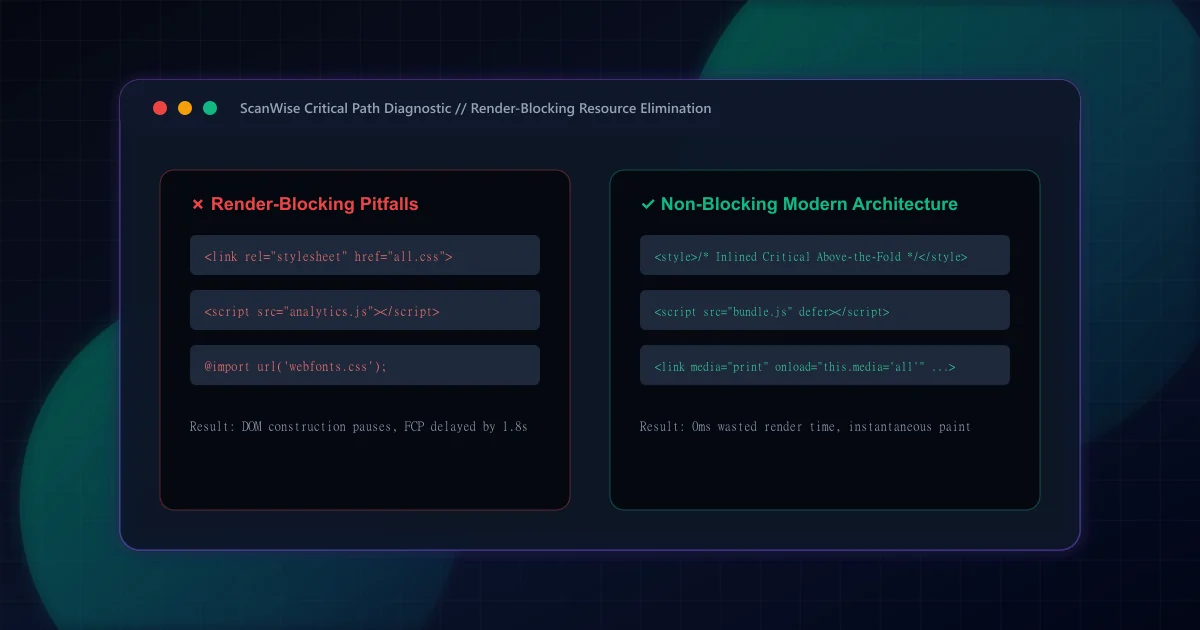
Render-Blocking Resources: How to Find and Eliminate Them
Eliminate render-blocking CSS and JavaScript. Learn how to identify critical path blockers in DevTools, inline essential styles, and defer script execution safely.
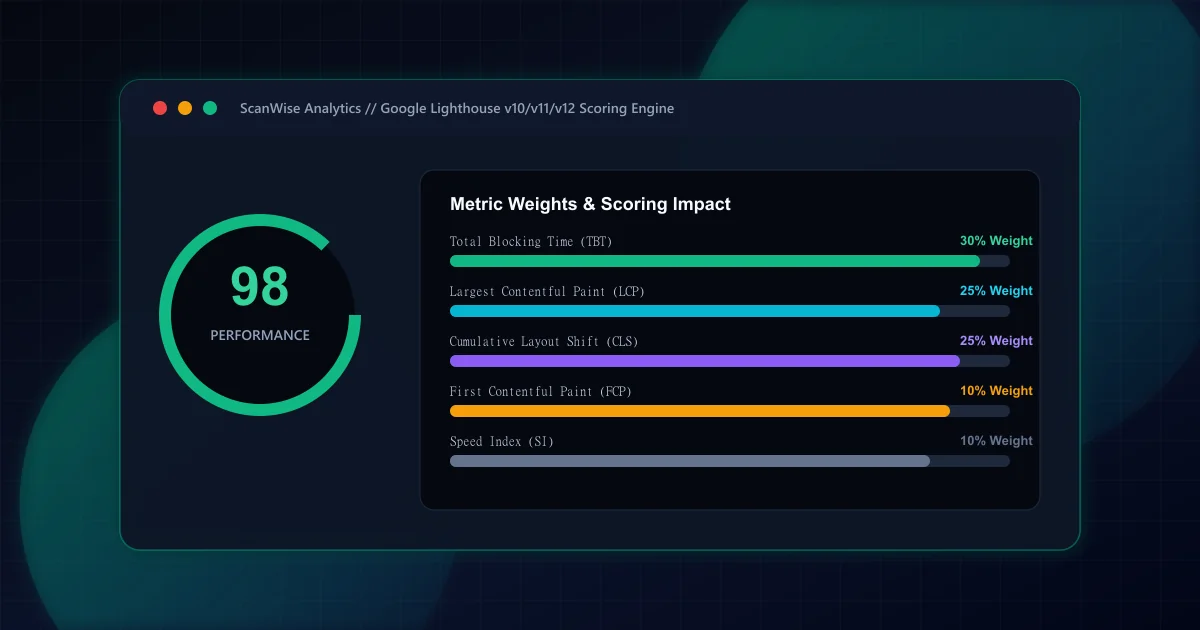
Lighthouse Score Explained: Metric Weighting and Audit Triage
Deconstruct how the Google Lighthouse performance score is calculated. Understand metric weightings, why 100/100 differs from field data, and what to fix first.